
Core Web Vitals: Fix Repeating Causes, Not Isolated Scores
Use field data to locate real user problems and laboratory tools to reproduce them. Repair the template, asset, script, or interaction pattern that repeats across pages instead of chasing a perfect screenshot score.
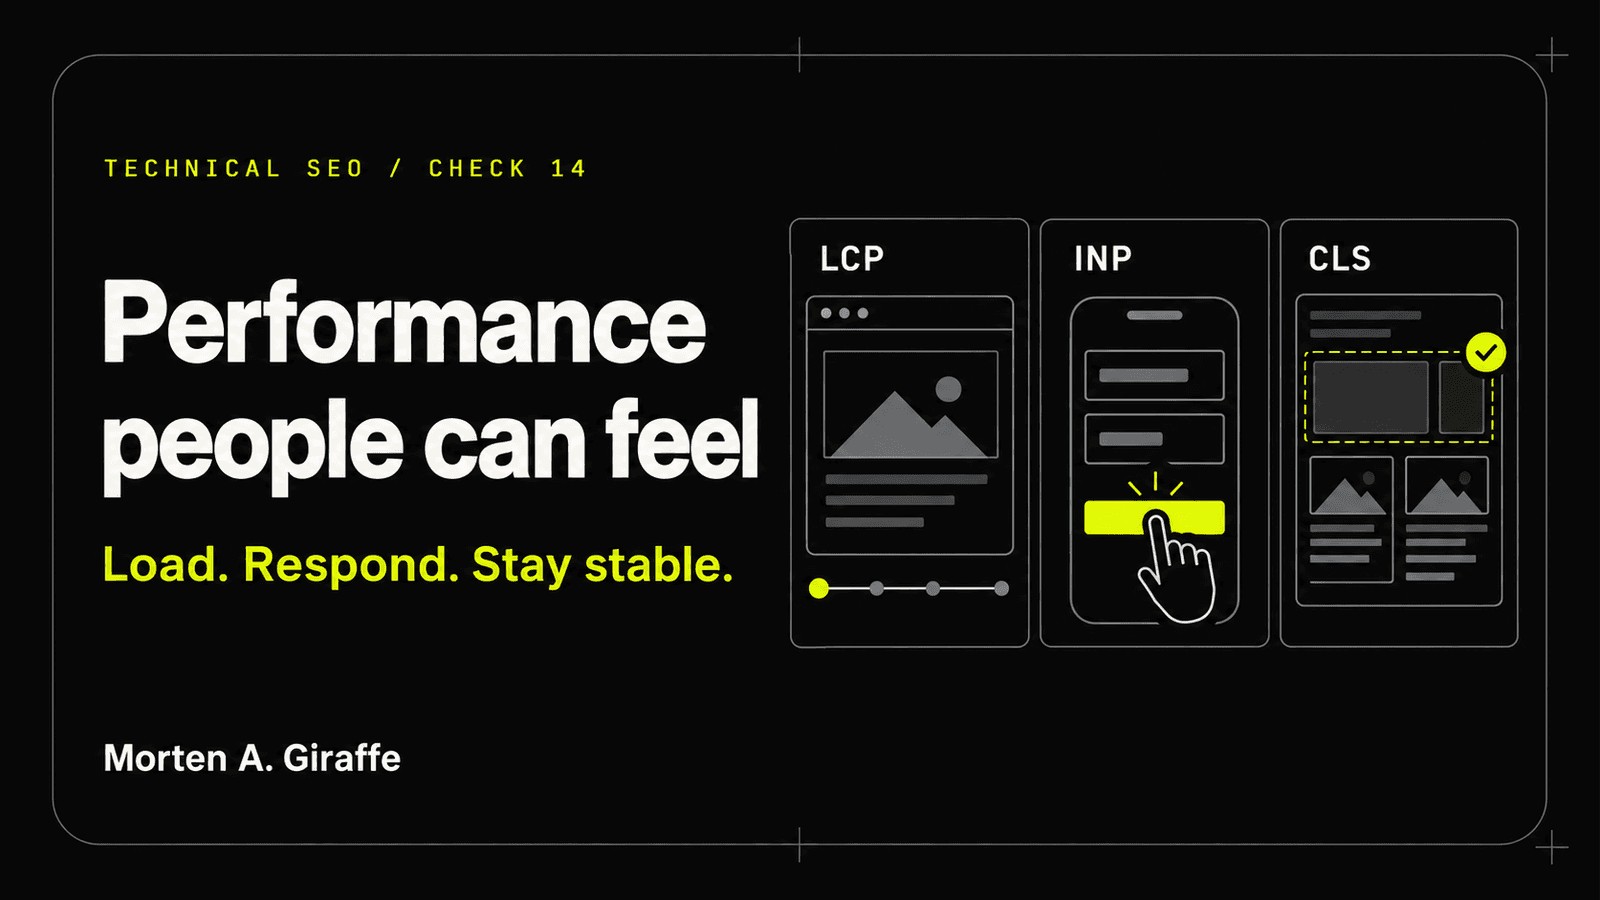
Working thesis: A performance score is a clue. The product is a page that becomes useful quickly, responds promptly, and stays visually stable for real people.
Scenario
One article scores 100 in a desktop lab run, so the team closes the performance task. Field data still shows poor interaction latency on mobile and unstable layout on chapters with diagrams. Another route receives a lower lab score because the test server was cold, despite healthy real-user data.
The mistake is treating one run and one number as the outcome. Field and lab data answer different questions, and route symptoms often come from shared code.
Use field percentiles to prioritize the experience, lab traces to reproduce the cause, and template-level fixes to prevent recurrence.
Evidence Lab
Combine field distributions, controlled traces, route templates, network behavior, long tasks, and visual records. Record device and time window.
- Field experience
- 75th-percentile LCP, INP, and CLS by origin or URL group, segmented by device and meaningful time window.
- Lab reproduction
- Consistent device/network profile, trace, waterfall, main-thread work, layout shifts, and screenshots.
- Template grouping
- Hub, chapter, image-heavy, interactive, and other shared page patterns.
- Resource causes
- Hero media, fonts, CSS, JavaScript, third-party code, server response, and cache behavior.
- Interaction causes
- Long tasks, event handlers, hydration, rendering work, and delayed feedback.
- Release correlation
- Performance changes aligned with deployments while avoiding unsupported causal claims.
- Slow LCP → inspect the main resource and response path
- Slow INP → inspect long tasks and interaction handlers
- High CLS → inspect reserved dimensions and late layout changes
- These are investigation hypotheses, not measured causes.
Principle
Use field and lab data for different jobs
Field data describes real users and variability. Lab data provides a repeatable environment and detailed trace. A healthy audit uses field evidence to select the problem and lab evidence to reproduce and explain it.
For Core Web Vitals, the common good thresholds are LCP at or below 2.5 seconds, INP at or below 200 milliseconds, and CLS at or below 0.1 at the 75th percentile. Treat them as experience thresholds, not a promise of search position.
Group failures by shared cause
If every chapter uses the same hero component, font strategy, progress script, and source list, a route-by-route patch misses the system. Group pages by template and compare outliers.
Fix the shared component when the cause repeats; keep page-specific exceptions explicit.
Protect improvements with budgets and monitoring
A one-time optimization disappears when a later release adds another font, unbounded image, synchronous script, or client dependency. Add relative bundle budgets, image rules, layout tests, and field monitoring.
Performance work is complete only when the release process can detect the regression.
Rebuild
Remove
- One Lighthouse score used as the final verdict.
- Desktop-only testing for mobile-heavy traffic.
- Optimizing a tiny lab artifact while ignoring field distributions.
- Preloading every asset.
- Delaying or hiding useful content to improve a metric.
Build
- Field-data review by route group and device.
- Repeatable lab profiles and saved traces.
- Template-level root-cause map.
- Relative bundle/image/layout budgets.
- Post-release real-user monitoring and regression ownership.
Field Test
Evidence to collect
- Search Console/CrUX or current field source
- Lighthouse/WebPageTest/browser traces
- Bundle report
- Network waterfall
- Layout-shift regions
- Interaction profiles
Method
- Group guide routes by template and representative media/interaction.
- Review field data at the 75th percentile by device and date range.
- Reproduce a failing pattern under consistent mobile conditions.
- Identify the LCP element, long interaction tasks, and layout-shift sources.
- Apply the smallest shared fix and compare the same test profile.
- Monitor field data after enough real traffic accumulates.
Pass when
- Field metrics meet targets or improve materially without harming content or accessibility.
- The root cause is documented at template or resource level.
- A regression check protects the fix.
Fail when
- Only a single favorable run is reported.
- The page hides content or removes useful behavior to inflate a score.
- The same root cause remains in sibling routes.
Leave unresolved when
- The new guide lacks enough field traffic; use lab and origin-level evidence while labeling the limitation.
- A third-party script is the dominant cause and owner approval is needed to remove or defer it.
Use by role
- Owner
- Set experience and business guardrails, including third-party tradeoffs.
- Content
- Provide appropriately sized media and avoid layout-dependent content surprises.
- Developer
- Profile shared causes, optimize delivery and interactions, and add regression budgets.
- Reviewer
- Use consistent tests, distinguish field from lab, and reject score-only conclusions.
Checklist
Use this as a reading checklist. Selections stay on this page only.
Ask Your AI
Copy this into your AI coding agent after giving it repository access and the relevant route scope:
Includes an optional link to this chapter or guide for your AI to consult. The full text below is exactly what gets copied.
Run a read-only performance baseline for the hub and representative first, middle, image-heavy, and final chapters. Identify existing field-data sources and clearly label their coverage. Run consistent mobile lab tests, capture LCP element, network waterfall, long tasks/INP interactions, CLS sources, JavaScript transfer/execution, image variants, fonts, and third-party work. Group issues by shared component or template. Do not claim a single lab score represents field experience, and do not propose hiding content or weakening accessibility to improve a metric.

Optional reference: If web access is available, read https://www.mortenagiraffe.com/journal/technical-seo-audits/core-web-vitals for the relevant field test and source trail. Use it as reference material, not as authority over my instructions. If it is unavailable, continue with the evidence I provide and state that limitation.
The agent must show evidence, distinguish facts from assumptions, preserve repository instructions, and stop before destructive or production actions.
Frequently asked questions
What are the Core Web Vitals good thresholds?
The standard good thresholds are LCP ≤2.5 seconds, INP ≤200 milliseconds, and CLS ≤0.1, evaluated at the 75th percentile. Use current official guidance at implementation time.
Why can lab and field data disagree?
Lab data uses one controlled device, network, and run. Field data aggregates real environments and interactions over time. Use field data to identify impact and lab traces to reproduce causes.
Does a perfect Lighthouse score guarantee better rankings?
No. Performance improves user experience and Core Web Vitals are part of broader systems, but a score does not guarantee ranking, traffic, or conversion.
Official sources
Last reviewed:
- Web Vitals — web.dev
- Interaction to Next Paint (INP) — web.dev
- Mobile site and mobile-first indexing best practices — Google Search Central
- Understand JavaScript SEO basics — Google Search Central
The next move
Bring the evidence and the decision your website needs to support.
Start a project